Introduction
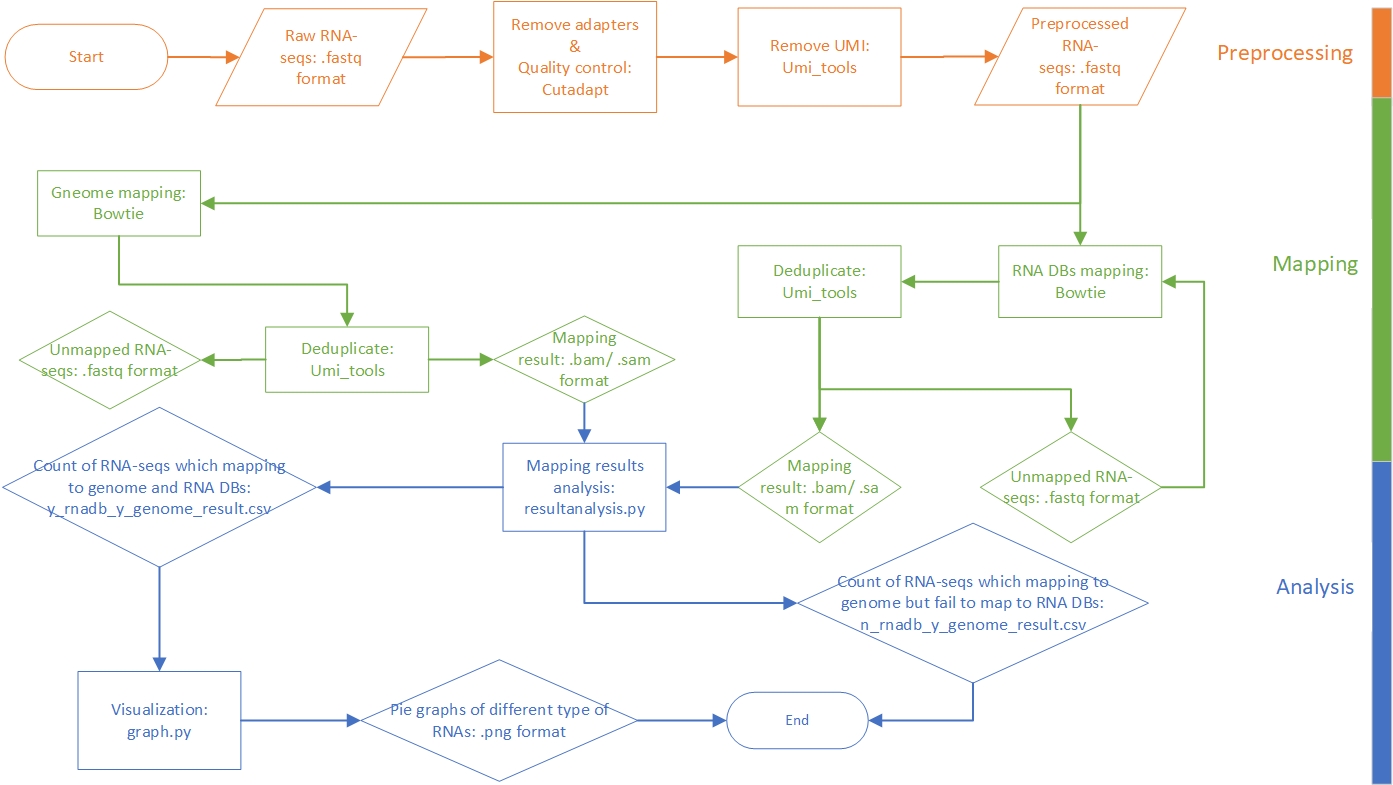
This pipeline is developed for annotating and profiling small RNAs with UMI attached to both ends. The raw data are reads in FASTQ format. After preprocessing and mapping to reference libraries, we can statistic the reads. Particularly, the reads which can be aligned to the genome but cannot be aligned to RNA sequences databases will be filtered out and written to a CSV format file. The following figure presents a general workflow of the pipeline.

Methods
Preprocessing
The preprocessing phase includes three parts: adapter extraction, quality control, UMI extraction. At first, adapters in 3’ end and 5’ end are removed by Cutadapt and then only reads whose length within 27~55nt are retained. Finally, UMIs in both 3’ end and 5’ end are extracted from sequence reads and add to read names with UMI-tools. At the UMI extraction step, reads with poor quality are dropped at the same time by UMI-tools.
Software and parameters used in this phase:
| Software | Parameter | Effect |
|---|---|---|
| Cutadapt | -j 40 | use 40 CPU cores |
| -a AGATCGGAAGAGCACACGTC | remove 3’ end adapter: AGATCGGAAGAGCACACGTC | |
| -g GTTCAGAGTTCTACAGTCCGACGATC | remove 5’ end adapter: GTTCAGAGTTCTACAGTCCGACGATC | |
| —overlap=3 | require at least three bases match between adapter and read | |
| —error-rate=0.1 | the level of error tolerance (mismatch) in adapter sequences searching | |
| —times=1 | trim no more than one adapter from each reads | |
| —minimum-length=27 —maximum-length=55 | drop reads shorter than 27nt or longer than 55 nt | |
| UMI-tools extract | —bc-pattern=NNNNNNNNN —3prime | extract 9nt as UMI from 3’ end |
| —bc-pattern=NNNNNN | extract 6nt as UMI from 5’ end | |
| —quality-filter-threshold 20 | filter low quality reads |
Mapping
The preprocessed reads are still in FASTQ format. The reads are aligned to genome and RNA databases with Bowtie, respectively. The following table lists the reference libraries we use in alignment. After aligning to references, the duplicate reads (reads with the same alignment position and UMI) will be dropped by umi_tools. After mapping, we can get the annotated reads in SAM format.
| Genome | RNA databases(sort by mapping order) |
|---|---|
| hg19 | mature tRNA |
| tRNA | |
| rRNA | |
| miRNA | |
| piRNA | |
| Rfam |
Software and parameters used in this phase:
| Software | Parameter | Effect |
|---|---|---|
| Bowtie | -q | input format: FASTQ |
| —threads 40 | run in 40 threads | |
| -v 1 | allow 1 mismatch | |
| -m 1 | each reads can only be aligned once | |
| -a | keep all mapping results | |
| -un | write all reads that could not be aligned to a file | |
| UMI-tools dedup | —method=unique | do not consider the sequencing mistakes in UMIs |
| —read-length | duplicate reads must have the same length |
Analysis
With the SAM format files in the mapping phase, we can count the reads. The reads with the same annotation will be counted as the same RNA. Pie graphs to visualize the percentage of different types of RNAs are plotted based on the counts. Besides counting the reads that mapping to the RNA databases, we can also filter the sequences that can be aligned to the genome but not to RNA databases. The statistics results are saved in y_rnadb_y_genome.csv and n_rnadb_y_genome.csv. The statistic and visualization are conducted with Python scripts.
Implement
The preprocessing phase and mapping phase are implemented by Shell scripts, and the analysis phase is implemented by Python scripts. The source code and more details of these scripts can be found in SmallRNASeq.
Full analysis results of samples can be found in the attachment.
Results
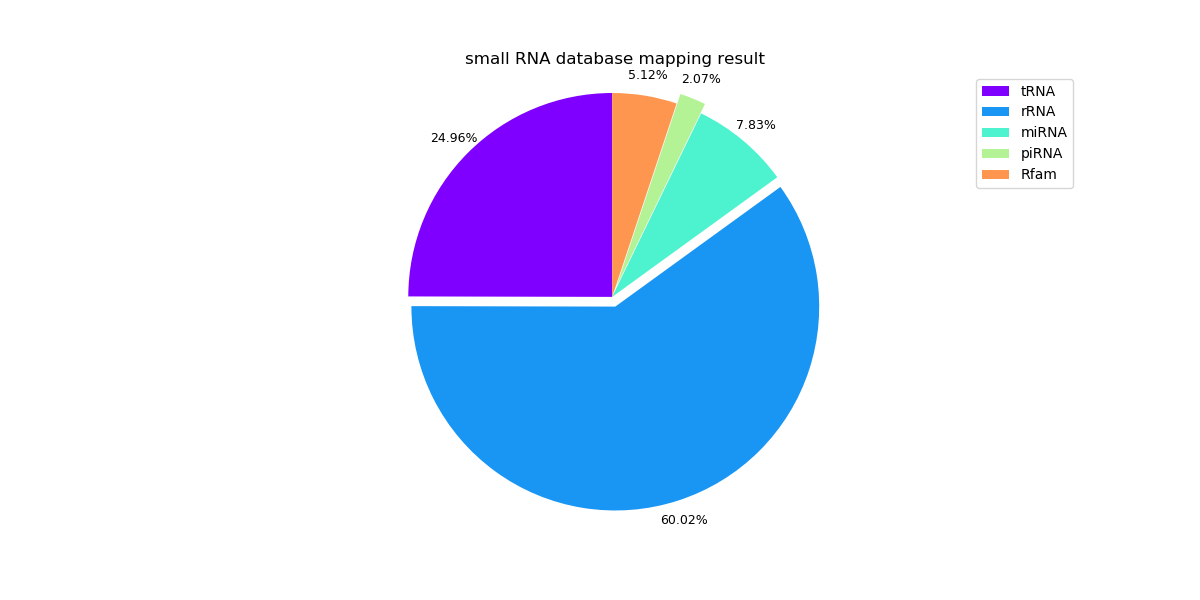
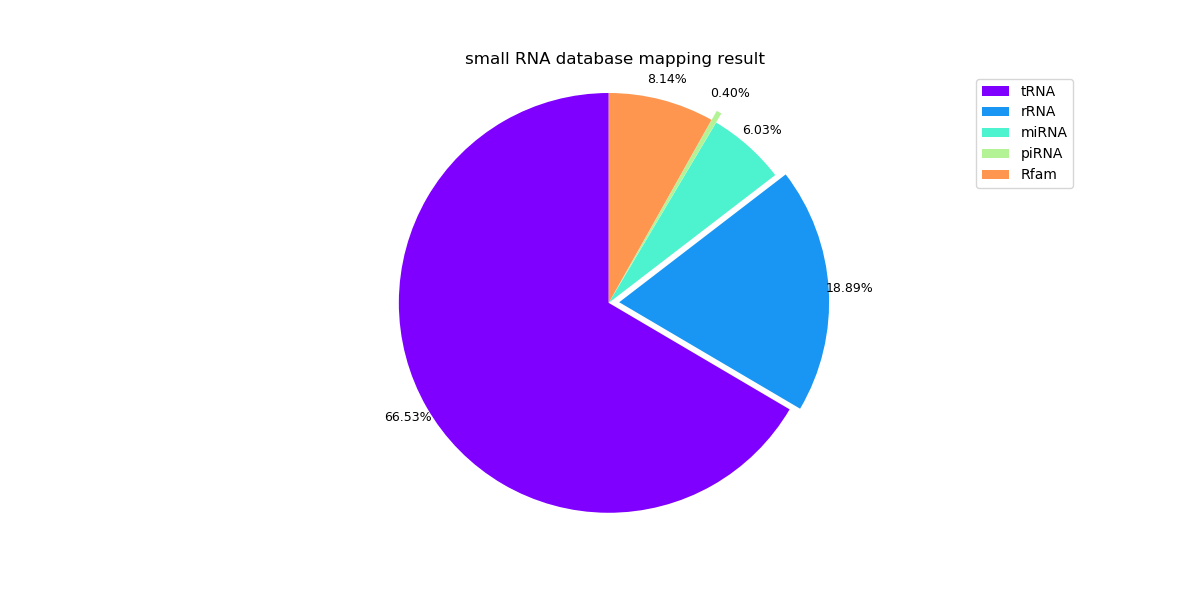
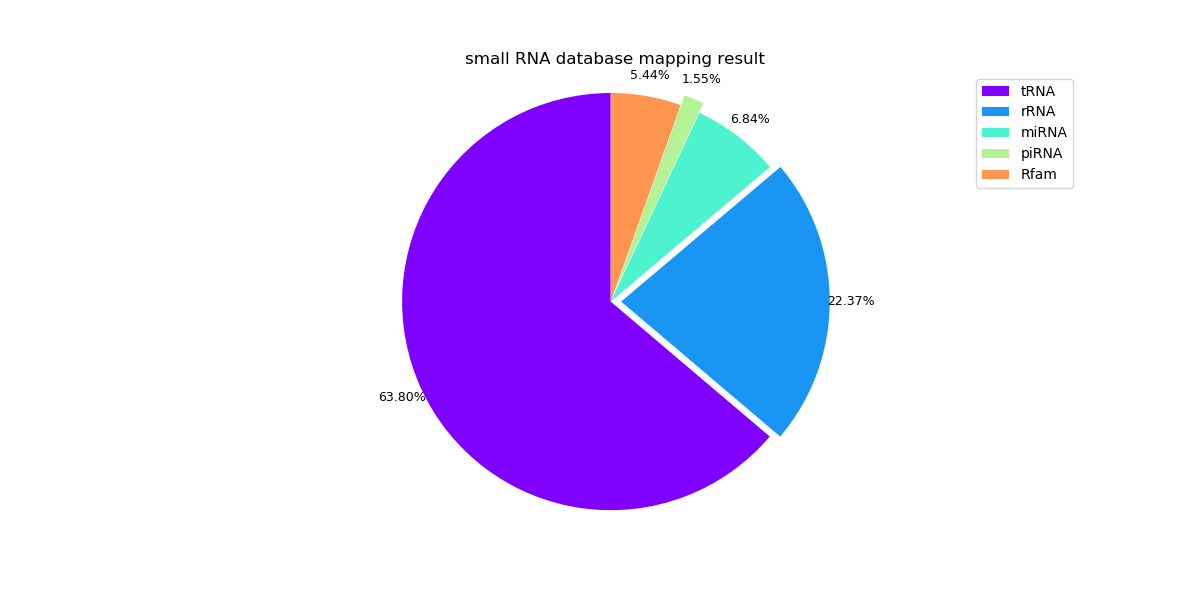
The following pie graphs show the mapping results of different samples.
Sample 1:

Sample 3:

Sample 5:

The head of the n_rnadb_y_genome.csv for sample 1:
